Real Estate Prediction in NYC
ProjectsReal Estate Prediction in NYC
Project Overview
This project leverages machine learning to predict property values in New York City by analyzing historical data from NYC Open Data. The implementation tackles common issues in real estate prediction, such as:
- Incomplete datasets with missing values
- Variances in data collected over different time periods
- The need for robust cross-validation and hyperparameter tuning for accurate predictions
- Visualization of spatial property value predictions over NYC
By integrating rigorous data preprocessing, model comparisons, and advanced visualization techniques, the project provides stakeholders with an informative tool to analyze market trends and make informed decisions in the NYC real estate market.
Key Features
- Data Preprocessing: Aggregates multiple datasets covering different time ranges, performs data cleaning including imputation of missing values, outlier removal, and feature scaling.
- Machine Learning Pipeline: Compares several regression models (Linear Regression, Random Forest Regressor, and XGBRegressor) and implements GridSearchCV for hyperparameter optimization.
- Visualization & Analysis: Generates scatter plots comparing actual vs. predicted property values and creates geographic heat maps to illustrate spatial trends in property valuations.
Project Implementation & Results
Libraries and Tools
The project utilizes a variety of Python libraries for data processing, analysis, and machine learning:
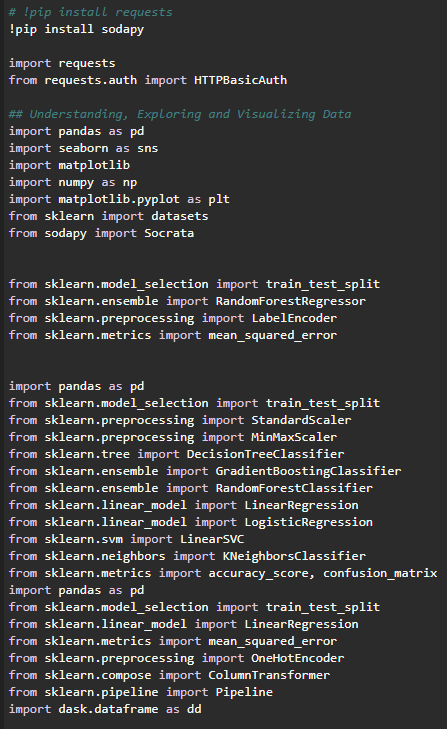
Libraries and Tools
Data Collection and Preprocessing
Two primary datasets were used in this project:
-
Dataset 1 (2010-2019): Contains historical property valuation data
2010-2019 Dataset Categories
-
Dataset 2 (2021-2023): Contains more recent property valuation data
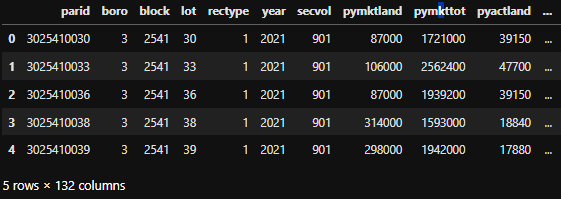
2021-2023 Dataset Categories
After analyzing both datasets, the most useful categories were identified:
Useful Categories from Dataset 1:
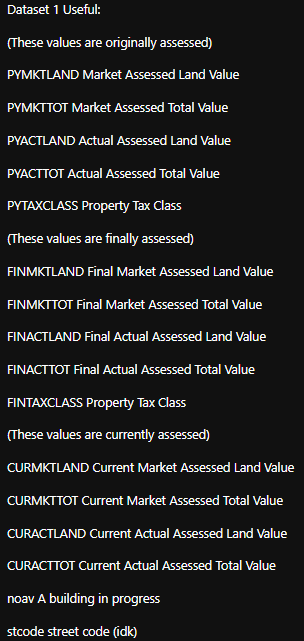
Useful Categories Dataset 1
Useful Categories from Dataset 2:
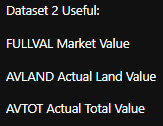
Useful Categories Dataset 2
Common Categories Between Datasets:
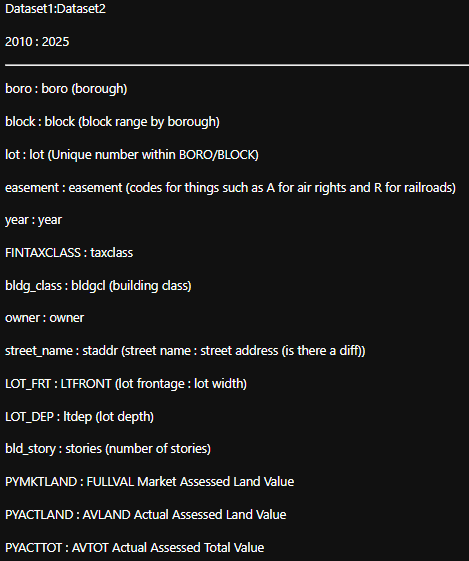
Common Categories
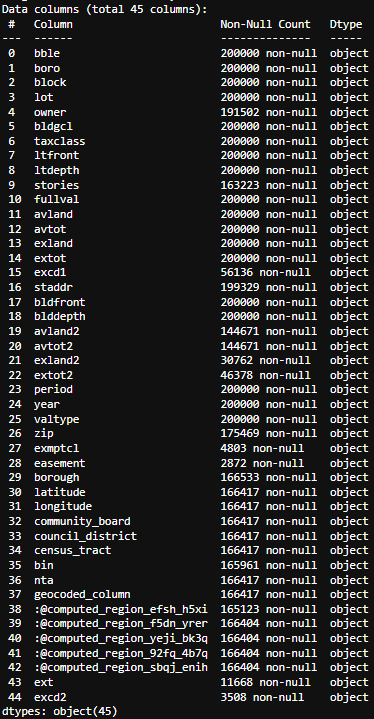
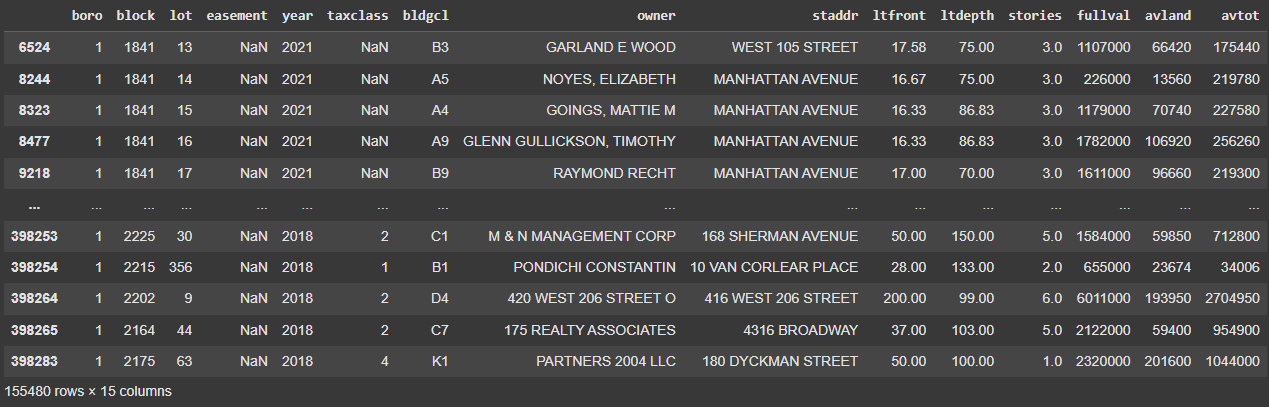
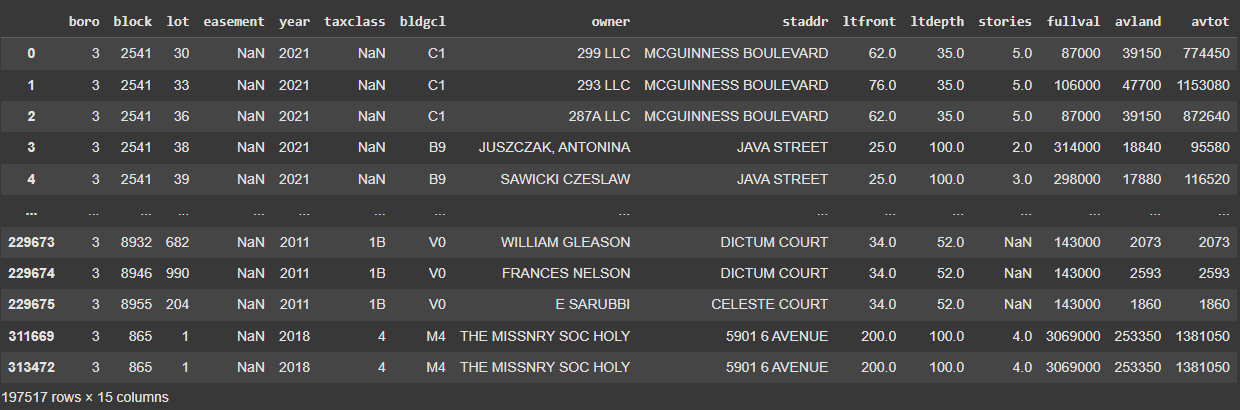
After merging and cleaning the datasets:
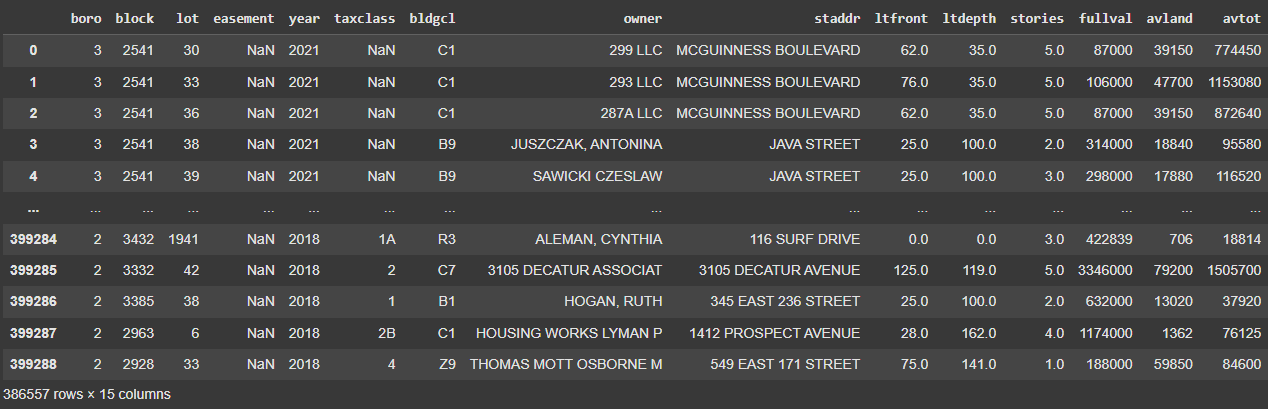
Merged and Cleaned Dataset
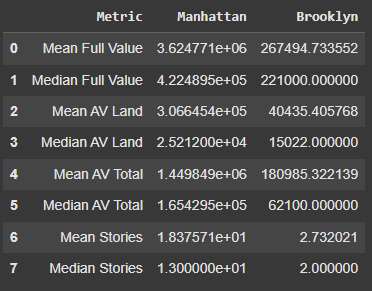
Data Analysis by Borough
The data was split by borough to account for different growth characteristics across New York City. This analysis revealed significant differences in data distribution:
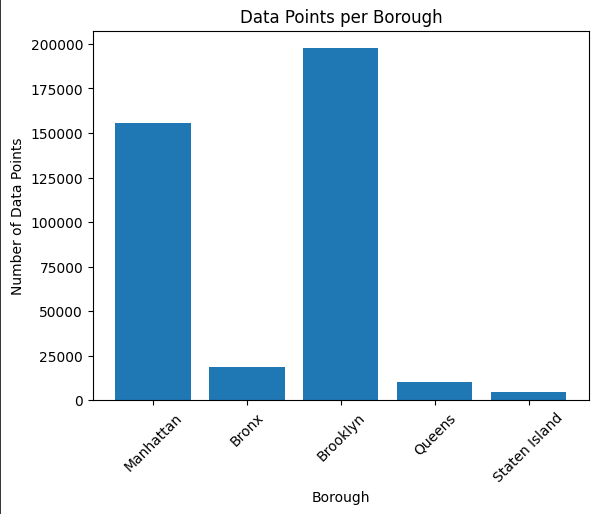
Datapoints per Borough
During data cleaning, some datapoints were removed due to missing values or outliers:
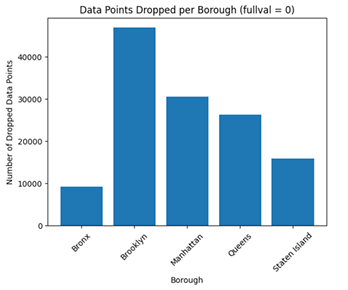
Datapoints Removed in Cleaning by Borough
The properties were visualized on maps to better understand their spatial distribution:
Manhattan Properties:
Properties in Manhattan Borough
Brooklyn Properties:
Properties in Brooklyn Borough
Data Distribution Analysis
To understand the price distribution, specific blocks were analyzed:
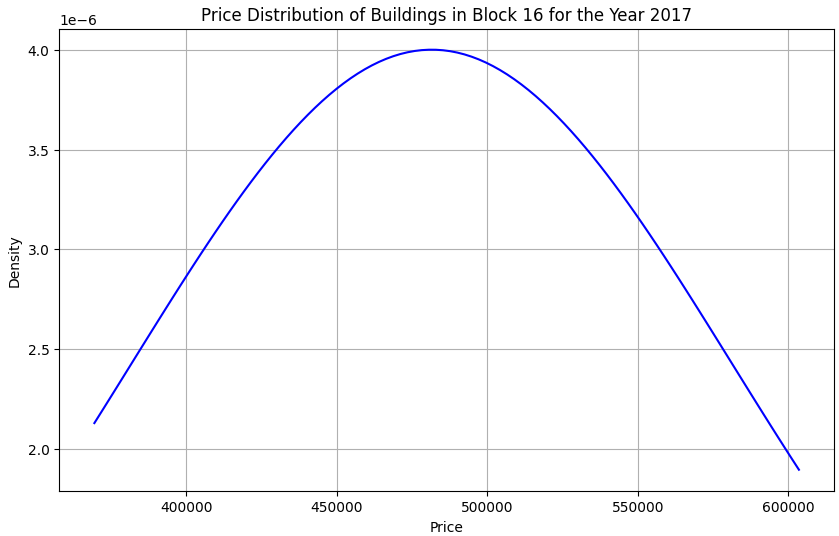
Price Distribution of Buildings in Block 16 for 2017
Before Cleaning:
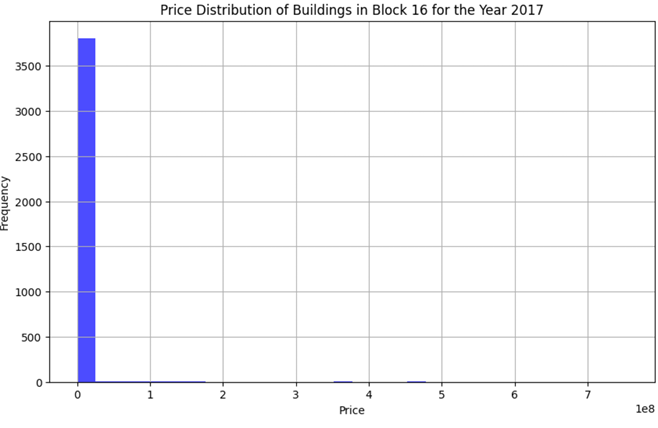
Price Distribution Before Cleaning
After Cleaning:
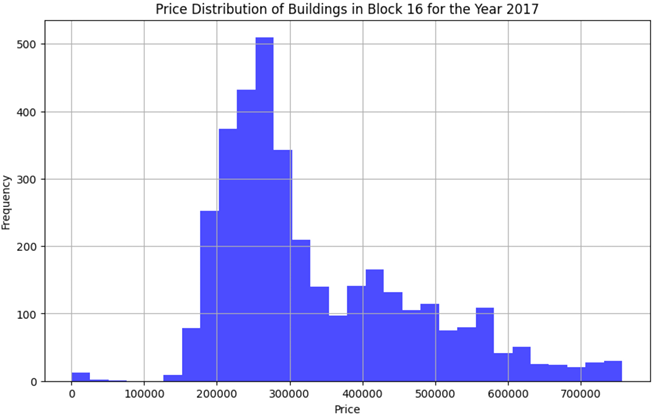
Price Distribution After Cleaning
Model Optimization
GridSearchCV was used to find optimal hyperparameters for the models:
GridSearch Results for n_estimators:
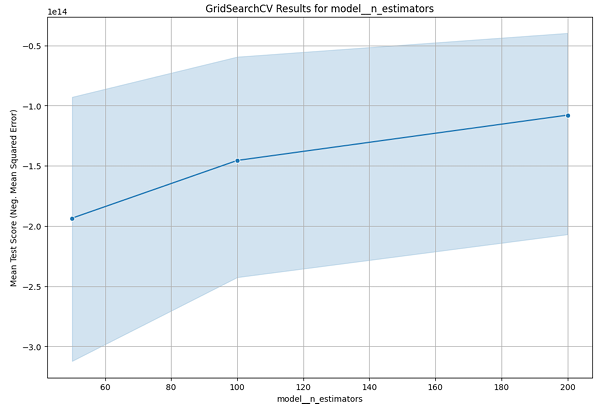
GridSearch CV Results for model_n_estimators
GridSearch Results for learning_rate:
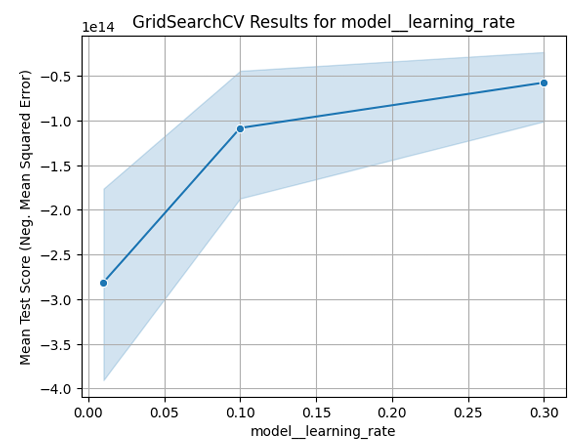
GridSearch CV Results for model_learning_rate
Best Parameters for XGBClassifier:
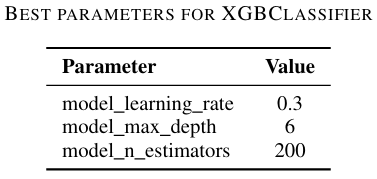
Best Parameters for XGBClassifier
Best Parameters for XGBRegressor:
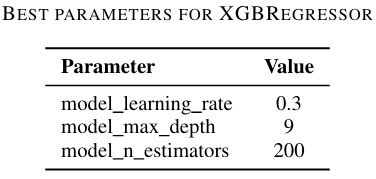
Best Parameters for XGBRegressor
Model Evaluation
The models were evaluated using various metrics to assess their performance:
Actual vs Predicted Values:
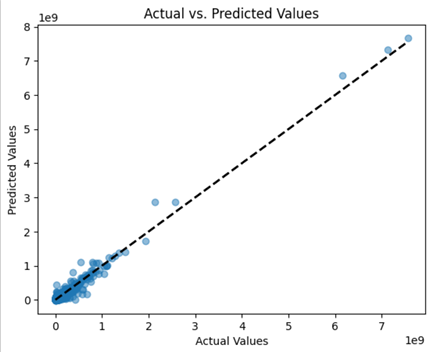
Actual vs Predicted Values
Model Metrics:
Metrics
Model Evaluation Metrics:
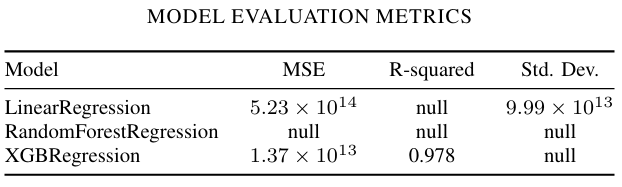
Model Evaluation Metrics
Classification Report:
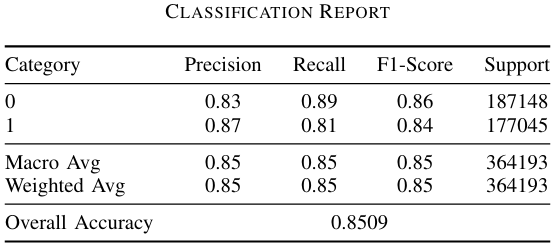
Classification Report
Conclusion
The Real Estate Prediction in NYC project successfully demonstrates the application of machine learning techniques to predict property values in New York City. After comparing several regression models, the XGBRegressor proved to be the most effective, achieving the lowest Mean Squared Error and highest R-squared value.
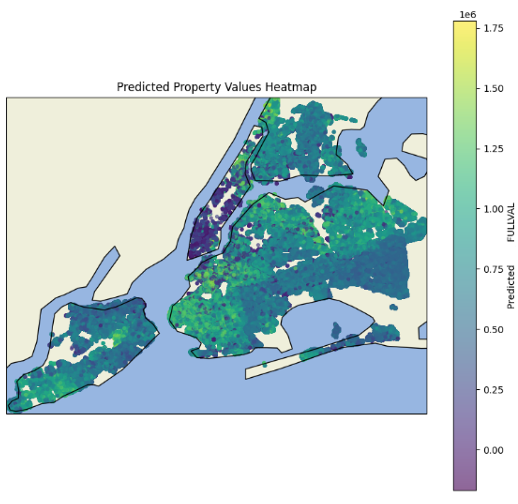
The heatmap visualization of predicted house values for 2025 provides stakeholders with valuable insights into future real estate trends across different boroughs:
Heatmap of Predicted House Value for 2025 NYC All Borough
This project demonstrates the importance of thorough data preprocessing, appropriate model selection, and rigorous evaluation in creating reliable property value predictions, which can be valuable for real estate investors, urban planners, and policymakers.